
Incident report: March 6, 2026


Summary
On March 6, between 04:34am PST and 09:18am PST, we experienced service degradation that resulted in elevated API response times and some timeouts.
We take a lot of pride in our reliability. In fact, this is the first big downtime in supermemory history.
(famous last words below)
9s of availability? What's that?@supermemory is insanely reliable :) pic.twitter.com/Wndvc6HExg
— Dhravya Shah (@DhravyaShah) February 23, 2026
Most importantly, this was not triggered by a change, or a misconfiguration. It does not happen often - It was a result of heavy load as more and more people use supermemory. This also happened middle of the night, when most of the team was offline.
Here's what happened, how we fixed it, and what we're doing to make sure your data operations scale smoothly going forward.
What Happened
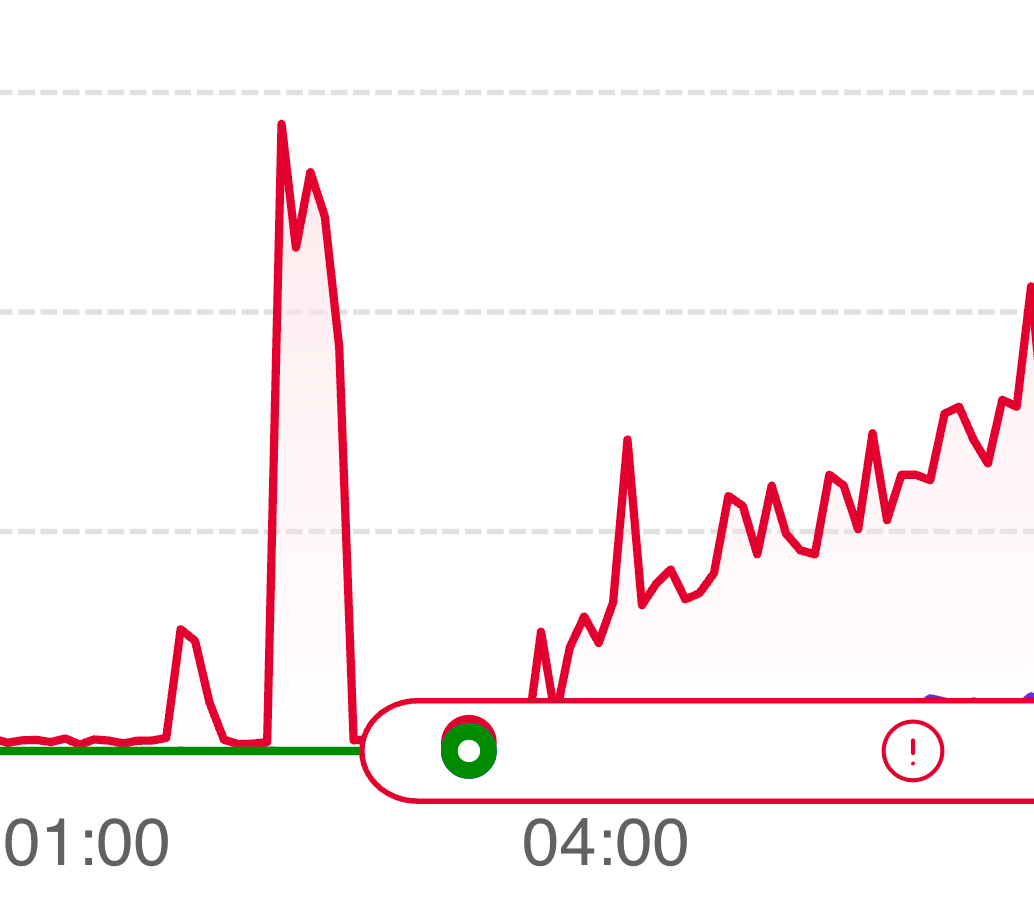
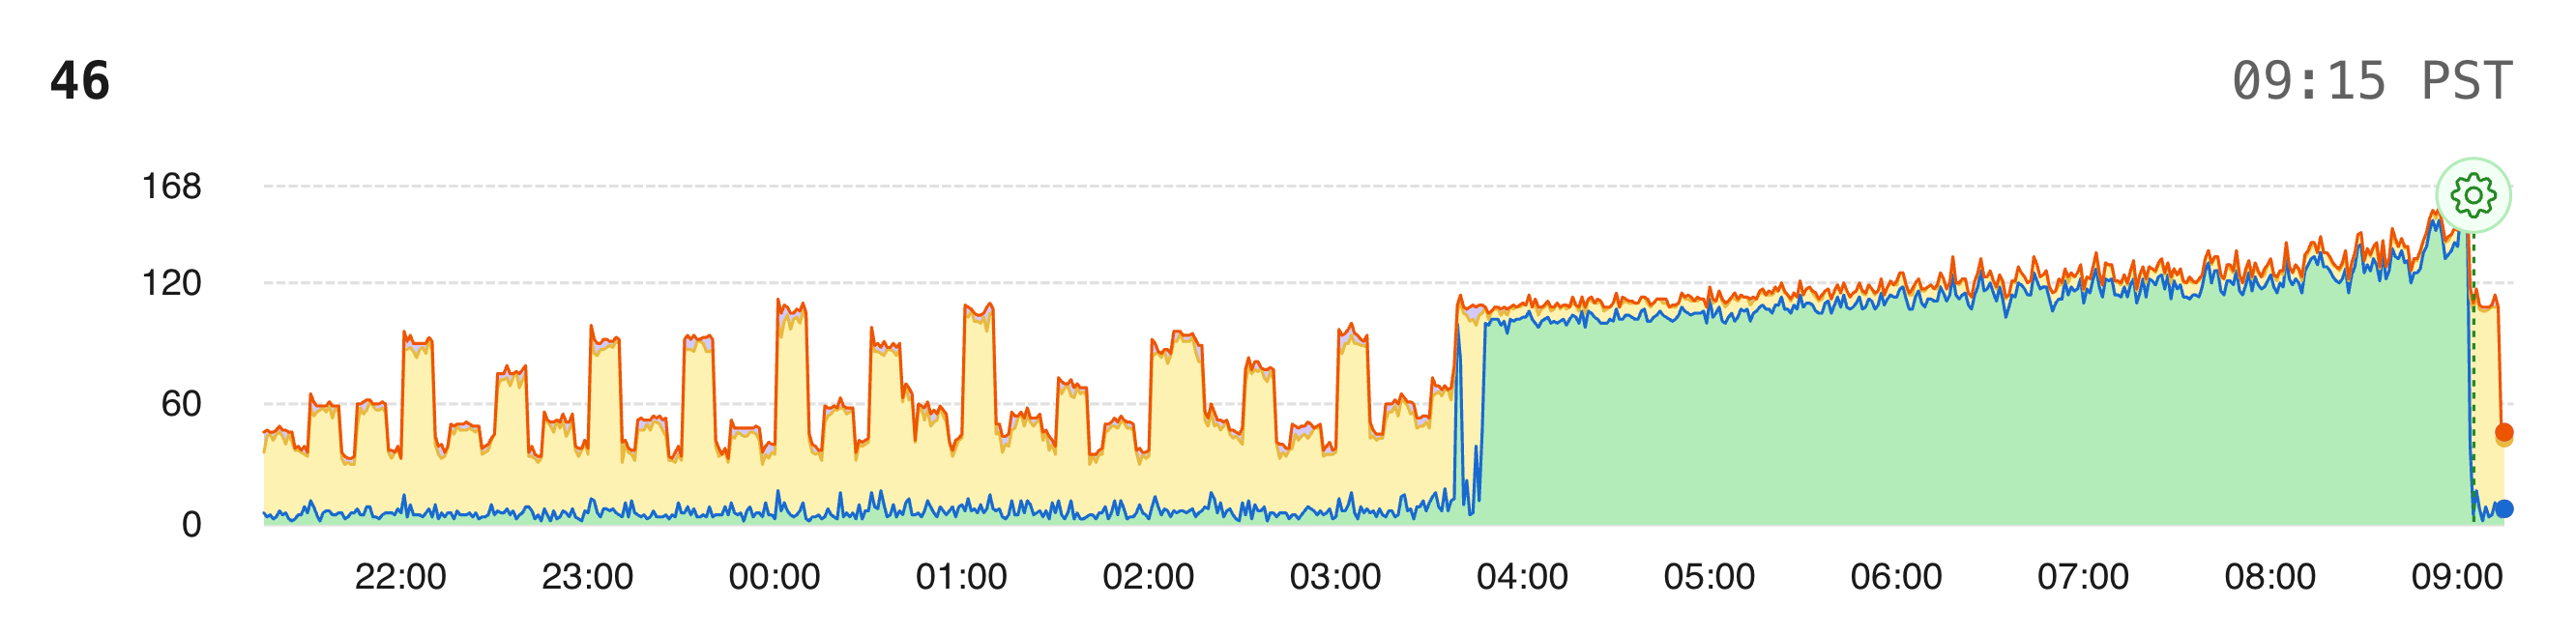
04:34 AM — Queries start taking unusually long
The team went to sleep after a very big data backfill, which was expected, and there was no issues. However, a few hours later, one query started to take 95% of the database runtime:
UPDATE apikey
SET last_request = $1, request_count = $2, updated_at = $3
WHERE apikey.id = $4
This is our API key tracking query — it runs on every authenticated request to update rate-limit counters. Under normal load, it's a fast single-row update by primary key. Completely harmless.
Why this specific query?
The query plan was fine — it used the primary key index. The problem was Postgres internals under high write volume.
Postgres doesn't update rows in-place. Every UPDATE creates a new row version and marks the old one as dead. Normally, Postgres optimizes this with HOT (Heap-Only Tuple) updates that skip touching indexes when no indexed column changes. But last_request is part of a composite index we use for rate-limit lookups (apikey_time_window_idx). So every single update also required a new index entry, dead tuples accumulated faster than autovacuum could clean them, and the index bloated.
Our database was already sitting at ~95% RAM utilization before any of this started, because of recent growth. As the table and indexes bloated, hot data got evicted from memory. Updates went from microseconds to milliseconds. Connections waiting on row-level locks piled up. The connection pool filled. And once the pool was full, even read queries — including the ones needed to authenticate requests — started timing out.
09:18 AM — Resolution
We identified the query as the bottleneck, took steps to reduce load, and restored service. Zero data loss.
Why didn't it trigger alerts, or the status page?
Both alerts and status page stayed up and showed no issues, mainly because the requests were taking long, but still executing. This was only a failure in API key reads, so session tokens still worked.
The team didn't get alerted because of this reason, and it didn't show up in the status reports. We have fixed this from our side as well.
What Worked Well
The System Stayed Up
Most API requests continued succeeding throughout the incident — they just took longer (extremely longer). We saw elevated latency, not widespread failures. The architecture degraded gracefully rather than falling over.
Data Integrity
Zero data loss. Requests queued rather than getting dropped, and everything processed successfully once service was restored.
Importantly, our app stayed up - since it uses session tokens, and all background jobs, workflows etc. kept running smoothly.
Why We're Sharing This
Transparency matters, especially when you're trusting us with your data infrastructure. We could've written a vague "we experienced some latency" post, but that doesn't help you understand our engineering practices or how we handle pressure.
And yes, we messed up.
What We're Fixing
Rate-Limit Tracking will be moved out of Postgres
The root cause — that UPDATE apikey query running on every request — is being eliminated. Rate-limit counters will no longer live in the hot path of our primary database. We're also dropping the composite index that was preventing Postgres from optimizing writes. This alone will reduce our database write load dramatically.
Database Memory Headroom
Running at 95% RAM baseline meant we were one traffic spike away from this kind of cascade. We're right-sizing our Postgres instance so there's room to absorb load spikes without evicting hot data to disk.
Monitoring Write Amplification
We're adding alerts on dead tuple accumulation, index bloat, and connection pool utilization — so we catch this pattern before it impacts service, not after.
Moving Forward
We know reliability is non-negotiable when you're building on top of our infrastructure. This incident happened, we handled it, and we're better for it.
We build in public, we share what goes wrong, and we fix it quickly. It's a part of our culture here at Supermemory.
We really really believe in being transparent and honest with our customers, and honestly, downtimes like this should not happen at all. Everything from the vendors that supermemory chooses, and the things we do, are done with utmost reliability in mind.
We failed you this time - and for that, we are really sorry.